5
The Hertzsprung-Russell Diagram & Stellar Evolution
The Hertzsprung-Russell (HR) Diagram is a fundamental tool in stellar astronomy / astrophysics for viewing and understanding stellar classification and the evolution of stars over time. With knowledge of the Stefan-Boltzmann law and the virial theorem you are already in a position to understand the basics of stellar evolution using this diagram.
Therefore, this chapter will give an overview of stellar populations and evolution on the HR diagram. In future chapters we will repeatedly return to this discussion as our understanding of the underlying astrophysics deepens.
1 Colour-Magnitude and Hertzsprung-Russell Diagrams from Photometry
1
Colour-Magnitude and Hertzsprung-Russell Diagrams from PhotometryIn Astronomy Techniques you have already been introduced to the concepts of Colour-Magnitude (CM) diagrams and HR diagrams. B-V Colour Magnitude diagrams are generated by measuring B and V magnitudes, and then plotting V vs B-V. An example using data from the SPIRIT telescopes for NGC 104 is shown below.
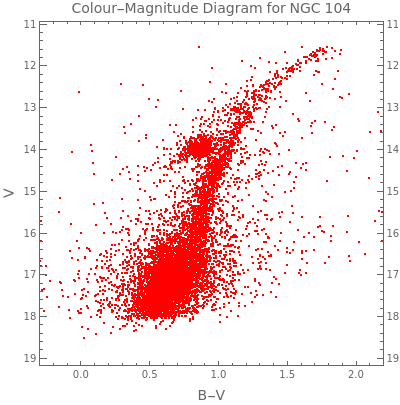
Figure 3.1 B-V Colour-Magnitude Diagram for NGC 104 (Data from SPIRIT telescope)
Image credit: Andrew Williams
Image credit: Andrew Williams
On the other hand an HR diagram is a plot of luminosity vs temperature. The temperature can be calculated from the values of using the formula
B-V
log
10
|
(
1
)To calculate the luminosity we first convert the V magnitudes into absolute magnitudes using
M
V
M
V
log
10
d
10parsec
(
2
)This requires us to have a good estimate of the distance to the star . For a cluster, we can usually approximate the distances to all stars as being approximately the same. The absolute magnitude is the magnitude that the star would have in the V filter if it were at a distance of from us. We next need to convert this to the bolometric magnitude, which is the absolute magnitude that the star would have if measured across all frequencies. It is calculated (estimated) using
d
M
V
10pc
M
Bol
M
V
(
3
)where BC is the temperature-dependent bolometric correction:
BC(T)-8.499+13.421-8.131-3.901((T)-4)-0.438.
4
((T)-4)
log
10
3
((T)-4)
log
10
2
((T)-4)
log
10
log
10
(
4
)Now recall that the absolute magnitude scale is related to the flux density and luminosity by
M
2
M
1
log
10
ℱ
2
ℱ
1
log
10
L
2
L
1
(
5
)The bolometric magnitude of the Sun is 4.74, and so we can use equation (==SolarLuminosity):
5
) to calculate the luminosity of a star (in units of L
⊙
L
Sun
log
10
L
L
⊙
4.74-
M
Bol
2.5
(
6
)With stellar temperatures from equation (
6
) and luminosities from equation (6
) we can then plot the HR diagram. An HR diagram for the stars in NGC 104 is shown in the figure below: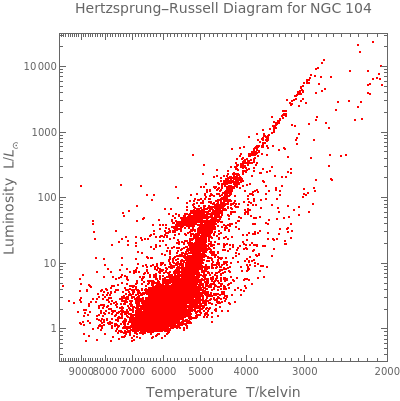
Figure 3.2 Hertzsprung-Russell diagram for NGC 104 (Data from SPIRIT telescope)
Same data as in the colour-magnitude diagram above.
Image credit: Andrew Williams
Same data as in the colour-magnitude diagram above.
Image credit: Andrew Williams
Note that an HR diagram requires knowledge of the distance to each star represented in the diagram, because the distance is required to calculate , equation (
M
V
6
). These distances are NOT required to plot a CM diagram, but if many of the stars represented in the CM diagram are at different distances, then the diagram will be completely jumbled compared to the corresponding HR diagram. On the other hand, if all the stars represented in the CM diagram are at approximately the same distance from the observer, then the CM diagram should just be a distorted version of the HR diagram. This will be the case where all the stars are in a cluster (assuming that the dimensions of the star cluster are small compared to the distance of the cluster from Earth). This is apparent in the figures above showing the CM- and HR-diagrams for the same data set measured from NGC 104.
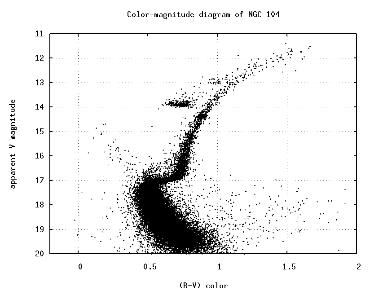
The colour magnitude diagram in Figure 3.1 was produced with data from a SPIRIT telescope on site at UWA. With a bigger, more sensitive telescope in a dark location, stars with magnitudes of 20 and higher (much dimmer stars) can also be observed. The resulting CM diagram in that case is shown in Figure 3.3
With diagrams such as this in mind, let us now discuss the evolution of stars.
2 Stellar Evolution
2
Stellar Evolution2.1 Dark Nebulae
2
.1
Dark NebulaeDark nebulae are dense, cold dust clouds (~10ºK to 100ºK) that block light from objects behind the nebula. They contain to particles . Unless you use Infrared (IR), you can only see them when they obscure things behind them. IR from dust escapes the nebula, dissipating heat and allowing particle velocities to drop, so the nebula contracts. The densest patches shrink fastest, forming small, dense clumps known as Bok Globules. These Bok Globules are where stars form – again, the densest patches shrink fastest, forming stars.
10
10
15
10
-3
m
2.2 Protostars
2
.2
Protostars2.2.1 Overview of the process
2
.2
.1
Overview of the processEach Bok Globule contains denser patches, which become protostars. A protostar starts out as a cool blob of gas, larger than our Solar System. Gravitational contraction heats up the gas.
Recall the virial theorem. Defining=+ to be the total mechanical energy of the particles in the system, then for a system in hydrostatic equilibrium:
Recall the virial theorem. Defining
E
Tot
E
GR
E
K
E
GR
E
K
E
Tot
E
GR
2
E
Tot
E
K
If the system gains or loses total energy (due to fusion or radiation) and it does so slowly then the star will remain in quasi-equilibrium and the virial theorem will apply at each step. Then we can say that if the total energy changes by , it will result in the changes
ΔE
Tot
ΔE
GR
ΔE
Tot
ΔE
K
ΔE
Tot
(
7
)That is, for every joule of energy radiated away from the star, goes down by 2 joules, and goes up by 1 joule, assuming it stays in quasi-equilibrium. This means that the star shrinks, and gets hotter.
Even though the internal temperature is increasing rapidly as the star shrinks, the surface temperature doesn’t necessarily change much – the exact behaviour depends on energy transport within the protostar.
After around 1000 years, a 1 protostar is 20 times larger than the Sun, and 100 times as luminous, at a temperature of ~3000ºK.
E
GR
E
K
Even though the internal temperature is increasing rapidly as the star shrinks, the surface temperature doesn’t necessarily change much – the exact behaviour depends on energy transport within the protostar.
After around 1000 years, a 1
M
⊙
On the H-R diagram, protostars of different initial masses will evolve along different tracks.
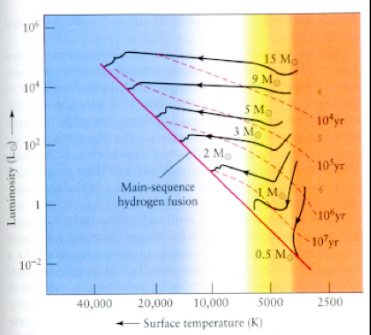
Protostars continue to radiate energy and shrink, while the core temperature increases. For sufficiently massive protostars, the central pressure and temperature will eventually get to the point where H fusion can commence. When H fusion commences the stars move onto the Main Sequence in the H-R diagram at which point the energy they radiate is replaced by the energy generated by fusion. The stars enter a very stable phase.
Larger stars start H fusion sooner than smaller ones, so the luminosity does not drop during their initial collapse, and many emit matter in the form of jets from an accretion disk.
Larger stars start H fusion sooner than smaller ones, so the luminosity does not drop during their initial collapse, and many emit matter in the form of jets from an accretion disk.
2.2.2 Small protostars (<0.5M⊙)
2
.2
.2
Small protostars (<0.5
M
⊙
Small protostars will be much more luminous than the main-sequence star they will become, although they will have about the same surface temperature. They become less luminous as they shrink, because the surface temperature stays almost constant. This means they collapse slowly, because they can’t radiate away the gravitational potential energy any faster They reach the main sequence in years or more.
8
10
2.2.3 Sun-like protostars (1-2 M⊙)
2
.2
.3
Sun-like protostars (1-2 M
⊙
These protostars start out like smaller prototstars, with a sharp drop in luminosity and only a small temperature increase. When fusion starts, they continue to shrink for some time, but increase in both luminosity and surface temperature. They reach the main sequence in around years.
7
10
2.2.4 Large protostars (>2 M⊙)
2
.2
.4
Large protostars (>2 M
⊙
Large protostars start H fusion sooner than smaller ones, and so do not change much in luminosity as they contract. The surface temperatures increase rapidly as they contract, speeding the rate of energy loss by radiation (and hence the rate of collapse). They reach the main sequence in as little as a few 1000 years, for the largest stars.
2.2.5 Example: NGC 2264 - 2 million years old
2
.2
.5
Example: NGC 2264 - 2 million years oldThe first example is NGC 2264 which is estimated to be 2 million years old. This open cluster has lots of gas, and low mass stars are still approaching the main sequence.
M 45 (the Pleiades) is estimated to be 50 million years old. We see that this has less gas, and the high mass stars are starting to leave main sequence (different scale to NGC 2264 plot).
Newly formed stars cover a wide range of masses, with low-mass stars being vastly more common than massive stars, as they are more likely to be ejected from the mass-accretion region before gaining more mass. The probability distribution function defining the distribution of stellar masses is called the ‘Initial Mass Function’. The word ‘Initial’ refers to the fact that in any actual population of stars, the mass function has been modified by evolution – supernova explosions, and less extreme forms of mass loss. The IMF is calculated from extrapolating the current, evolved stellar population back to the initial mass distribution. This observed IMF agrees with numerical simulations
The Main Sequence band contains 90% of the stars around us. Despite this fact, most of the stars visible to the naked eye are not main sequence stars, because giant stars are visible at much larger distances. The hot-bright end are high-mass stars, the cool-dim end are low-mass stars. High mass stars are much less common than low mass stars, so the Main Sequence is much more densely populated at the cool/dim end than it is at the hot/bright end. The high mass Main Sequence stars are up to one hundred million times brighter than the low mass stars. Main Sequence stars are burning hydrogen in their core, and they move off when the hydrogen in the core runs out. High-mass stars burn fuel much faster than lower mass stars, and have shorter lives.
In fact, the main sequence is not a single thin line on the H-R diagram. It is a band, because the luminosity of a main-sequence star at a given temperature depends on the composition of the star. And of course this changes as a star converts H to He on the main sequence, and it also depends on the initial composition of the star. Hence the location of a Zero-Age star on the (Zero-Age) main sequence will be different to that of an aging main-sequence star. In the following diagram, evolution inside the main sequence is shown between the solid and dashed lines, and the dashed line marks the end of core Hydrogen burning.
We will now go through and look at each stage of this post-main sequence evolution in detail.
When the hydrogen in the core runs out, the central helium core starts collapsing, and heat from the core collapse helps hydrogen in a shell around the core to start fusing. At this time the star begins to move off the main sequence in the H-R diagram; this is known as the “Turn off” from the main sequence.
The energy from the core collapse increases the temperature in the shell and so increases the rate of fusion. The increase in temperature in the shell causes the star to expand and the exterior to cool. While this is occurring the star remains at approximately the same luminosity, but its surface temperature cools and it moves across the redder end of the spectrum. During this process the star is a Sub-Giant on the Sub-Giant Branch (SGB). Helium produced in the shell burning “rains” down onto the core.
The energy from the core collapse increases the temperature in the shell and so increases the rate of fusion. The increase in temperature in the shell causes the star to expand and the exterior to cool. While this is occurring the star remains at approximately the same luminosity, but its surface temperature cools and it moves across the redder end of the spectrum. During this process the star is a Sub-Giant on the Sub-Giant Branch (SGB). Helium produced in the shell burning “rains” down onto the core.
Helium shell burning is a violent, cyclic process that results in mass loss from the star. When helium in a shell around the core runs out, the heat from below no longer supports the Hydrogen layer above it and it contracts and heats. The hydrogen layer starts shell burning hydrogen, which ‘rains’ Helium down on the layer below. Eventually that new Helium layer ignites in a ‘Helium Flash’ and burns very quickly. That extra heat from the Helium burning expands and cools the Hydrogen layer again, stopping Hydrogen shell burning.
AGB stars have very strong stellar winds, losing up to one ten-thousandth of their mass per year – so they can obviously only stay in this stage for a few thousand years, at most. A process called ‘dredge up’ during red-giant expansion phases has brought up lots of processed material from the core (Carbon and Oxygen from Helium burning). The surface temperature is low enough for emitted carbon molecules to form small grains of ‘soot’. The ejected gases and carbon dust often forms an obscuring blanket around the AGB star
These later stages of burning occur in an onion-layer structure and leave a wide range of products.
The following colour-magnitude diagram for the cluster M3 shows real data for 2-3 stars caught in the post-AGB/pre-white dwarf phase of evolution (indicated as P-AGB on the figure).
The following are examples of planetary nebulae.
It will be noticed in some H-R diagrams for some star clusters (such as NGC 104 above) that there appear to be some more massive blue stars left on the main sequence, when the age of the cluster indicates that they should already have evolved beyond the Turn Off. These stars are referred to as Blue Stragglers. The most likely scenario for the formation of these stars is that they evolved in accreting binary systems or resulted from the merger of one or more smaller stars.
If we plot the H-R diagram for a stellar cluster, then we can assume that all the stars were created at approximately the same time. Soon after creation all the stars would have been on the main sequence. At a much later time, for an old cluster, the higher mass stars will have evolved off the main sequence, and the H-R diagram will clearly show the stages of stellar evolution (as we have seen).
The more massive a star is, the shorter its lifetime. The stars at the bright, blue, end of the main sequence run out of hydrogen and turn into Red Giants long before the less massive stars. We can use a Hertzsprung-Russell diagram (or, more commonly, a Colour-Magnitude diagram) to determine the age of a cluster of stars. If all stars in the cluster formed at the same time, the location of the Turn-Off from the main-sequence can be used to determine the cluster’s age.
The following figure shows the H-R diagrams for two different clusters. NGC 188 is older than M 67 and this is evident in the fact that the turn-off point for NGC 188 is lower on the main sequence (it has evolved further).
Represented in this plot are the schematic CM diagrams for a range of clusters of different ages. If we can locate the turn-off point for a particular star cluster we are observing, then we can use this diagram to approximately determine the cluster’s age!
If you have computed the Luminosity corresponding to the turn-off point, then you can estimate the age using the following formula (for Main-Sequence Lifetime):
On the other hand we can also plot an H-R diagram for all the stars in different clusters and in our galaxy; including any star for which we have data. This we would then refer to as “The” H-R diagram. Some of the massive luminous stars will still be on their main sequence. Others will have evolved off it. The diagram will be a superposition of diagrams for clusters of different ages. Diagrammatically it can be represented as follows.